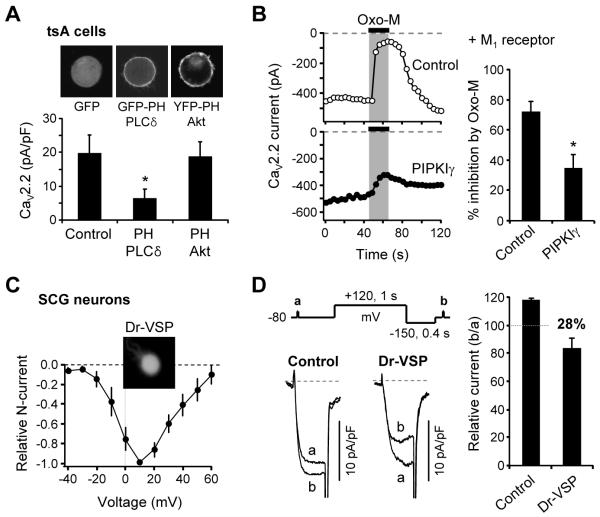
Figure 5. PIP2-Dependent Modulation of CaV2.2 N-type channels.
(A) CaV2.2 current density (pA/pF) was measured in cells expressing the CaV2.2 channels plus GFP, GFP-PH-PLCδ1, or YFP-PH-Akt. The cells were transfected with the same amounts of cDNA. Average membrane capacitances for cells are 22 ± 2 pF for GFP (n = 11), 25 ± 4 for PH-PLC (n = 11), and 24 ± 4 for PH-Akt (n = 12). Top, Confocal images of tsA cells expressing each fluorescent protein. Cell diameters were 20 - 30 μm.
(B) Elevated PIP2 levels attenuate CaV2.2 channel inhibition by M1 receptor stimulation. CaV2.2 currents were measured in control cells and in cells transfected with PIPKIγ. Right, Summary of current inhibition by Oxo-M. Data are mean ± SEM. *P < 0.05, compared to control.
(C) Current-voltage (I-V) relations of N-type CaV current in isolated rat SCG neurons expressing Dr-VSP (n = 3) with a widefield image of one neuron.
(D) Inhibition of N-type CaV currents by Dr-VSP activation in SCG neurons. N-type CaV currents were measured during test pulses before and after a +120-mV/1-s depolarizing pulse in control and cells expressing Dr-VSP. Capacitive and leak currents were subtracted by a P/5 procedure. Right, Summary of N-type current inhibition by Dr-VSP activation in SCG neurons. Data are mean ± SEM (n = 3 for control, n = 3 for Dr-VSP).

