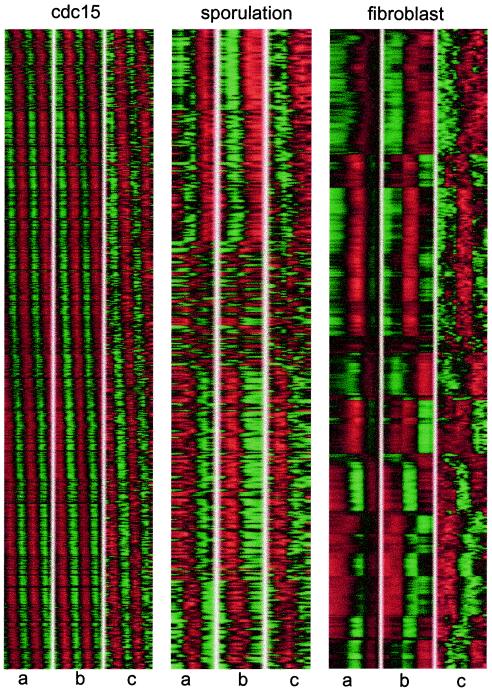
Figure 3.
A reconstruction of the expression profiles for the cdc15 (Left), sporulation (Center), and fibroblast (Right) data sets. For each set, a shows the results obtained by using the 2 × 2 time translation matrix to determine the temporal evolution of the expression profiles from their initial values, and b shows expression levels expressed as linear combinations of just the two top modes, whereas c shows the experimental data.

