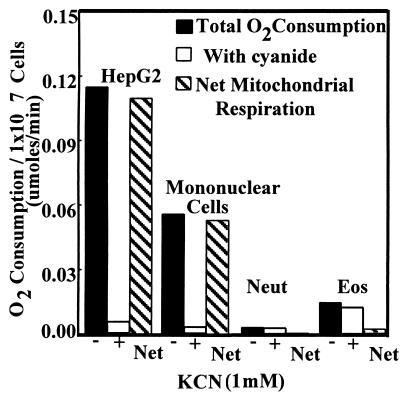
Figure 2.
Measurement of respiration of Eos by cyanide-inhibitable O2 consumption. As positive controls, the hepatocyte cell line HepG2 and primary human mononuclear cells were used. Human neutrophils were used as a negative control. The solid bars indicate O2 consumption without cyanide present. The white bars indicate O2 consumption with cyanide present. Gray bars indicate the net O2 consumption contributable to mitochondrial respiration. Bars represent means from four experiments.

