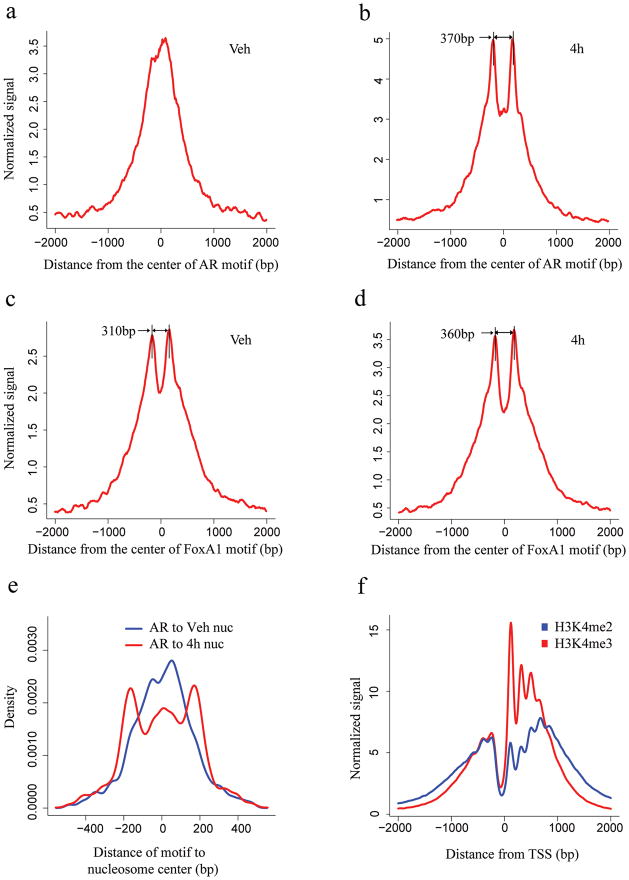
Figure 1. Signal distribution and nucleosome position analysis in the AR and FoxA1 binding regions identified by ChIP-chip experiment and the TSS.
H3K4me2 signal distribution relative to the center of the AR motif (a, b) and FoxA1 motif (c, d) in the binding regions. The x-axis represents the distance to the center of the best AR or FoxA1 motif match in a given binding site. The y-axis represents normalized ChIP-Seq tag count numbers. “Veh” represents the unstimulated condition; “4h” represents stimulated conditions with treatment of DHT for 4 hours. (e) Distance from the AR motif to the center of the nearest nucleosome in the AR binding sites under vehicle (red) and 4 hours after DHT stimulation (blue). (f) H3K4m2 and H3K4me3 signal distribution relative to the TSS.

