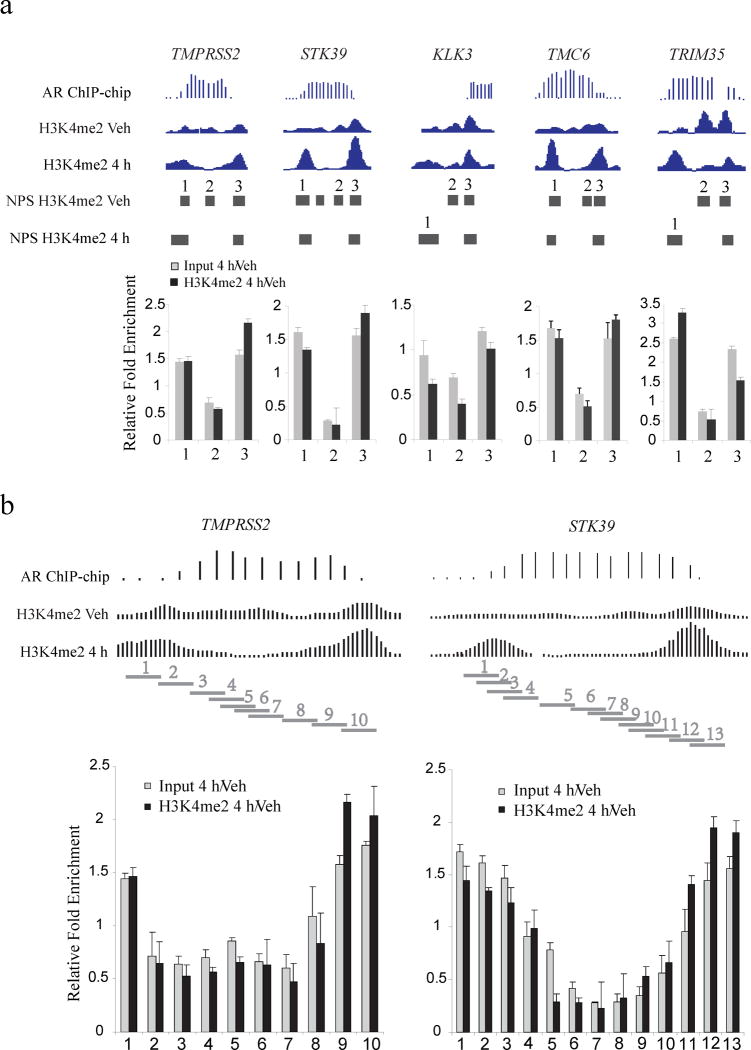
Figure 2. qPCR validation of the nucleosomes stabilized-destabilized around AR binding sites.
(a) Five AR binding sites near the genes TMPRSS2, STK39, KLK3, TMC6 and TRIM35. “AR ChIP-chip” represents the AR ChIP-chip signals; “H3K4me2 Veh” and “H3K4me2 4h” represent H3K4me2 ChIP-Seq signals before and after 4 hours of DHT treatment. “Input 4h/Veh” represents the qPCR assay of nucleosome fold change for DHT treatment relative to vehicle; “H3K4me2 4h/Veh” represents the qPCR assay of fold change for H3K4me2 signal for DHT treatment relative to vehicle, standard deviation is shown. Each horizontal bar represents a NPS peak region. (b) Detailed qPCR analysis of the AR binding sites near the genes TMPRSS2 and TMC6. Each horizontal bar represents a qPCR amplification region.

