
Figure 7.
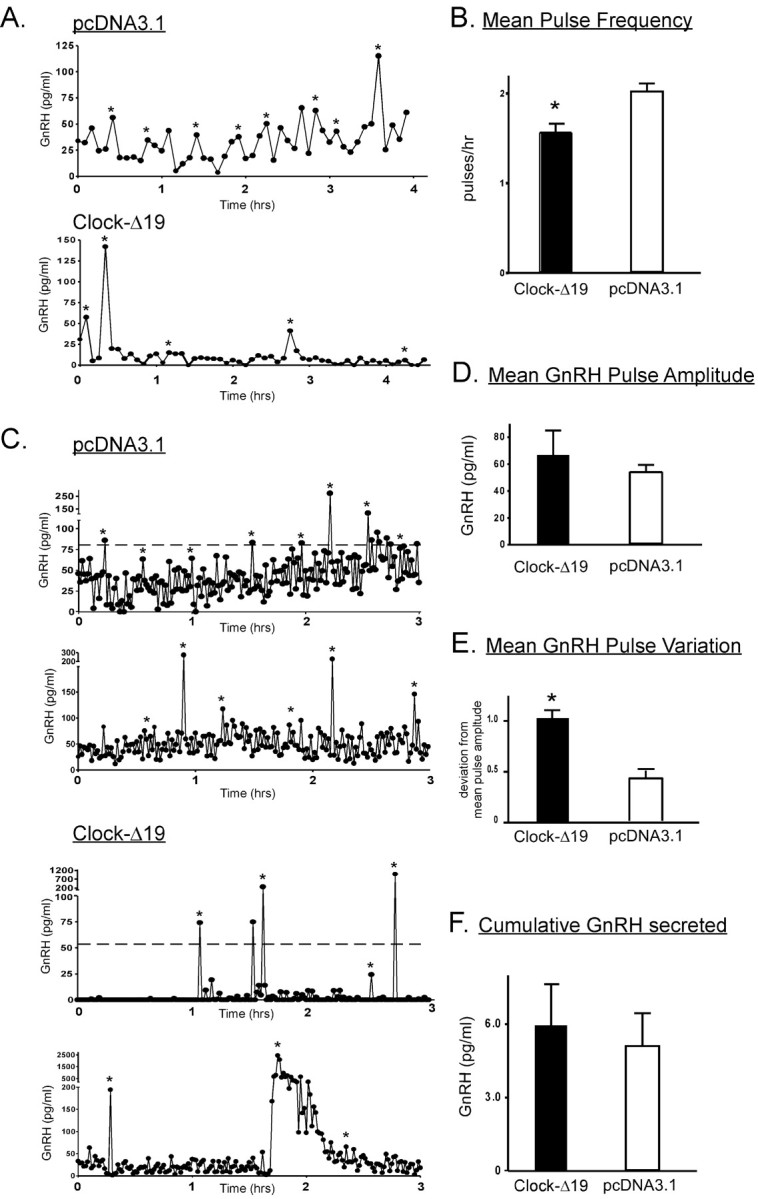
Expression of Clock-Δ19 results in alteration of GnRH pulsatile secretory patterns. A, Representative 5 min GnRH pulse profiles of perifused pcDNA3.1-transfected (top) and Clock-Δ19-transfected (bottom) GT1-7 cells. B, Mean pulse frequency of all sample periods was significantly (*p < 0.01) reduced in perifused Clock-Δ19-transfected cells. C, Representative 1 min GnRH pulse profiles of pcDNA3.1-transfected cells and Clock-Δ19-transfected GT1-7 cells. D, Mean pulse amplitude of Clock-Δ19-transfected cells, although highly variable, was not significantly different from control-transfected cells. Mean pulse amplitude variability, calculated as mean variation from normalized mean pulse amplitude within each 10 hr sampling period, is shown in E and was significantly (*p < 0.01) different between treatment groups. The bar graph in F indicates cumulative GnRH released over the 10 hr sampling period. Although control cells exhibited a stable baseline of release (top), Clock-Δ19-transfected cells displayed high-amplitude bursts of secretion, followed by a return to baseline. Bar graphs in B, D, E, and F represent mean pulse frequency, pulse amplitude, amplitude variability, and cumulative GnRH secretion, respectively, with n = 8 in each experimental and control group, and were derived from both 5 and 1 min sampling data.