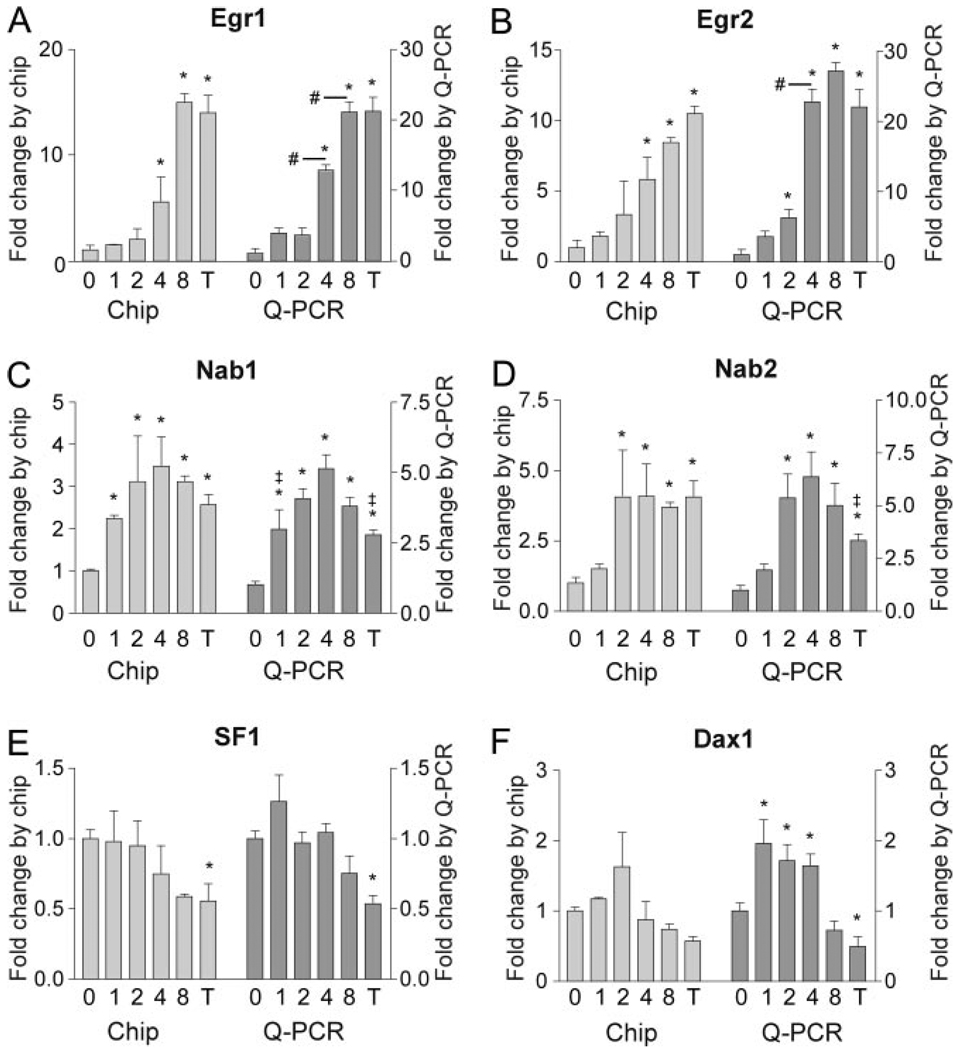
Fig. 2. Confirmation of Gene Expression Patterns Identified Using VAMPIRE Analysis of Affymetrix Microarray by Real-Time Q-PCR.
Patterns of gene expression under zero, one, two, four, and eight pulses/4 h or tonic treatment regimes with 100 nm GnRH are compared from the microarray analysis and from confirmatory Q-PCR of independent samples. The immediate early genes Egr1 (panel A) and Egr2 (panel B) and their corepressors Nab1 (panel C) and Nab2 (panel D) are confirmed to be sensitive to high- and low-frequency pulses, respectively. The regulation of the transcription factor SF1 (panel E) and its corepressor Dax 1 (panel F) are also shown. Dax 1 expression was not identified as significant in the microarray analysis; however, analysis by real time Q-PCR identified a significant increase under low-frequency pulses. *, Significant difference (P ≤ 0.05) from vehicle-treated control; #, significant difference from the preceding treatment group in panels A and B; ‡, significant difference or GnRH-treated groups from four pulse/4 h treatment in panels C and D. chip, Chromatin immunoprecipitation; T, tonic.

