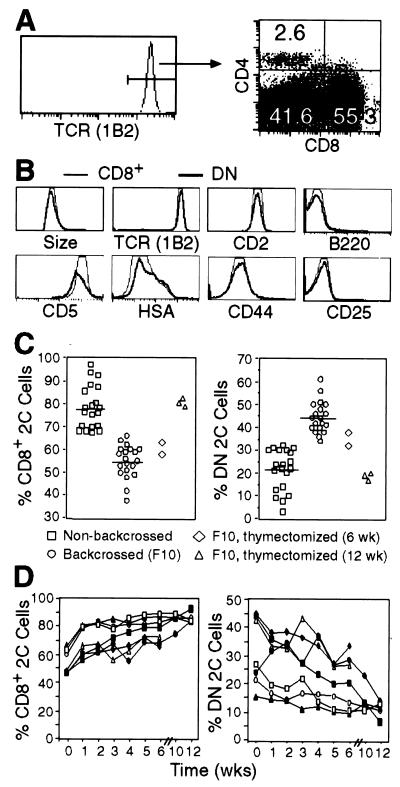
Figure 1.
Analyses of surface markers of CD8+ and DN 2C T cells and their relative abundance before and after thymectomy. (A) Lymph node cells from backcrossed 2C/RAG mice were assayed for 2C TCR, CD4, and CD8. The histogram shows 2C TCR expression as detected by clonotypic antibody 1B2. The two-dimensional dot plot shows CD8 and CD4 expression by 1B2+ cells. Numbers indicate the percentages of CD4+, CD8+, and CD4−CD8− 2C cells. (B) Comparison of the cell size (forward light scatter) and indicated cell surface markers between CD8+ (thin line) and DN (bold line) 2C cells in 2C/RAG mice. Lymph node cells were assayed for 2C TCR, CD4, CD8 plus CD2, CD44, CD25, CD69 (not shown), CD5, HSA, or B220. Histograms are generated by gating on 1B2+CD8+CD4− or 1B2+CD8−CD4− cells. (C) Percentages of CD8+ and DN 2C cells in the lymph nodes of various types of mice. Lymph node cells from backcrossed (F10) and nonbackcrossed 2C/RAG mice and thymectomized 2C/RAG (F10) mice 6 or 12 weeks after surgery were assayed for 2C TCR, CD4, and CD8. CD8+ and DN 2C cells are shown as percentages of total 1B2+ cells. Each symbol represents one mouse. (D) Percentages of CD8+ and DN 2C cells in peripheral blood at different time points after thymectomy. 2C/RAG mice (F10) were thymectomized at 6–8 weeks of age. Peripheral blood leukocytes were assayed for the expression of 2C TCR, CD4, and CD8. The percentages of CD8+ and DN 2C cells are shown as a function of time for each mouse.

