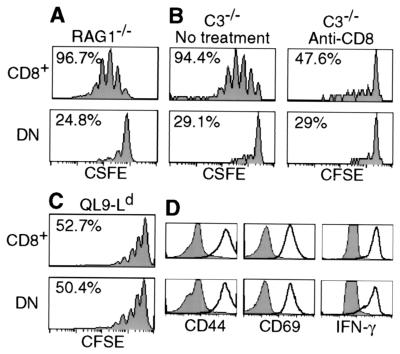
Figure 2.
Requirement for CD8 for lymphopenia-induced 2C cell proliferation. (A) CFSE-labeled lymph node cells (1 × 10⁶ CD8+1B2+) from 2C/RAG mice were transferred into RAG1−/− recipients. Seven days later, lymph node cells were recovered from recipients and analyzed for 2C TCR, CD4, CD8, and CFSE. CFSE profiles are shown for CD8+ and DN 2C cells. Percentages refer to proportion of cells that proliferated within 7 days. (B) CFSE-labeled lymph node cells from 2C/RAG mice were incubated with 10 μg/ml of anti-CD8α antibody on ice for 30 min and transferred into irradiated C3−/− recipients (1 × 10⁶ CD8+1B2+/recipient). The recipients were injected with 500 μg of anti-CD8α immediately after transfer and again the next day. As a control, CFSE-labeled 2C cells were treated in the same way but without antibody and recipients were not injected with antibody. Lymph node cells from recipients were analyzed for 2C TCR, CD4, CD8β, and CFSE 5 days after transfer. CFSE profiles are shown for CD8β+ and DN 2C cells in anti-CD8-treated and untreated recipients. Percentages refer to proportion of cells that proliferated within 5 days. (C) CFSE-labeled lymph node cells from 2C/RAG mice were stimulated in vitro with irradiated BALB/c splenocytes in the presence of 1 × 10⁻⁷ M QL9 peptide for 3 days. Cells were analyzed for 2C TCR, CD4, CD8, and CFSE. CFSE profiles are shown for CD8+ and DN 2C cells. (D) Lymph node cells (not labeled by CFSE) were stimulated as in C. Cells were analyzed for 2C TCR, CD4, CD8, plus CD44, CD25 (not shown), CD69, or intracellular IFN-γ. Histograms of CD44, CD69, and IFN-γ expression by CD8+ and DN 2C cells are compared before (shaded) and after stimulation (bold).

