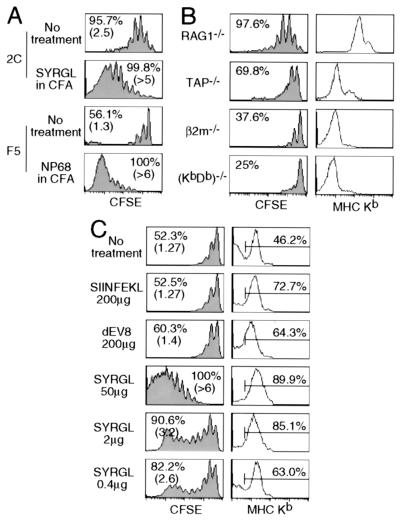
Figure 3.
Effect of pepMHC on the proliferation of 2C cells in lymphopenic recipients. (A) Comparison of proliferation of CD8+ 2C and CD8+ F5 cells in lymphopenic recipients that were either untreated or injected with cognate agonist peptides in CFA. CFSE-labeled lymph node cells (1 × 10⁶ CD8+TCR+) from 2C/RAG or F5/RAG mice were transferred into syngeneic RAG1−/− recipients. Two days later, some of the 2C T cell recipients were challenged with 50 μg of SYRGL peptide in CFA and some of the F5 T cell recipients were challenged with 50 μg of NP68 (ASNENMDAM) peptide in CFA. Lymph node cells from recipients were analyzed for TCR, CD8, and CFSE 5 days after transfer. Proliferation of CD8+ 2C and CD8+ F5 cells are shown. Percentages refer to proportion of cells that proliferated within 5 days. Numbers in parentheses indicate the average division of cells that proliferated. (B) Comparison of CD8+ 2C cell proliferation in various lymphopenic recipients. CFSE-labeled lymph node cells from 2C/RAG mice (1 × 10⁶ CD8+1B2+) were transferred into RAG1−/− recipients or irradiated TAP−/−, β2m−/−, or (KbDb)−/− recipients. Five days later, lymph node cells were analyzed as in A. CFSE profiles of CD8+ 2C cells from one representative experiment are shown (Left). Percentage refers to proportion of cells that proliferated within 5 days. Peripheral blood leukocytes were assayed for CD11c and Kb. Kb expression by CD11c+ cells is shown (Right). (C) Effect of peptides on Kb expression and 2C cell proliferation. CFSE-labeled lymph node cells from 2C/RAG mice (1 × 10⁶ CD8+1B2+) were transferred into irradiated TAP−/− recipients. Recipients were either untreated or injected i.p. with 200 μg of SIINFEKL, 200 μg of dEV8, or 0.4, 2, and 50 μg of SYRGL in PBS on the day of transfer and the next day. Lymph node cells from recipients were assayed for CD11c and Kb, or 2C TCR, CD8 plus CFSE 5 days after transfer. CFSE profiles of CD8+ 2C cells are shown (Left). Percentages and numbers in parentheses are as in A. Expression of Kb on CD11c+ cells in lymph nodes is shown as histograms (Right). Percentages of positive cells are shown.

