Fig. 2.
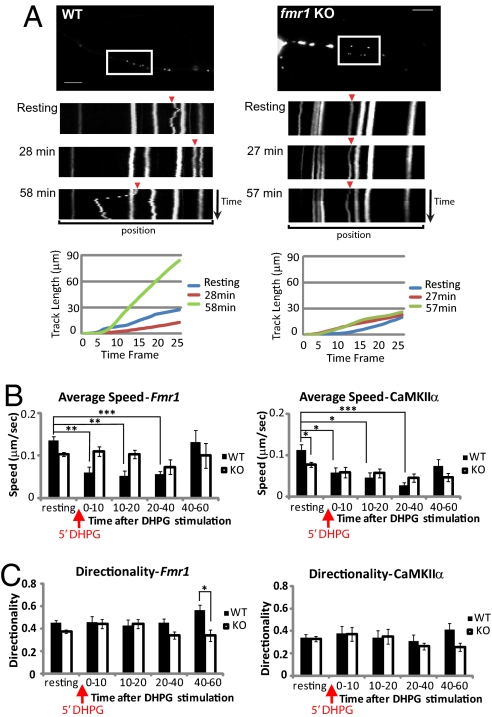
CaMKIIα and Fmr1 mRNA dynamic motions in WT and fmr1 KO hippocampal neurons. (A) Representation of Fmr1 mRNA movement in WT and fmr1 KO neurons by time-lapse imaging. Kymograph (upper) shows granule motion in the boxed region of a WT or KO neuron transfected with GFP-MS2-nls and MS2bs-Fmr1. The time point of the image taken is labeled next to each kymograph, which represents a 2-min series of images at 5-s intervals (25 frames in total). (Scale bars, 20 μm.) Track length (lower) of each quantified Fmr1 granule (arrowhead in kymograph) was represented. Track length is the total length of displacements within the track. (B) Average speed of GFP-labeled Fmr1 or CaMKIIα mRNA calculated for WT or fmr1 KO neurons shows that particle movement was retarded in WT from 0 to 40 min after stimulation. (C) Directionality of GFP-labeled Fmr1 or CaMKIIα in WT or fmr1 KO neurons was calculated, showing increased unidirectional movement of Fmr1 mRNA in WT neurons. Bar graph represents data from three experiments, total of at least 20 mRNA particles in each group. Experiments and definition of average speed and directionality were as described in Materials and Methods. Statistical analysis by two-way ANOVA with Tukey's HSD posttest. Error bars denote SEM.

