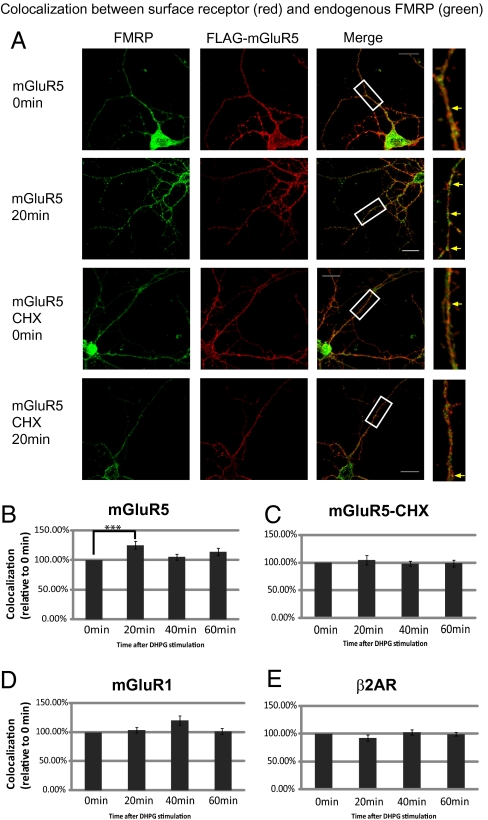
Fig. 3.
Colocalization between surface group I mGluRs and FMRP after DHPG treatment. (A) Representative deconvolved image (Z projection) detected surface mGluR5 (red) and endogenous FMRP (green). Higher magnification of the boxed images shows that more FMRP colocalized with surface mGluR5 at 20 min after DHPG (yellow arrow), but not in the presence of CHX. (Scale bars, 20 μm.) (B–E) The increased colocalization between FMRP and surface mGluR5 at 20 min was measured as Manders's coefficient. The time points indicate the time post-washout after 5-min DHPG incubation. Data were analyzed from at least 15 dendrites in each group from three independent experiments. Statistical analysis by one-way ANOVA with Dunnett's posttest. Error bars denote SEM.

