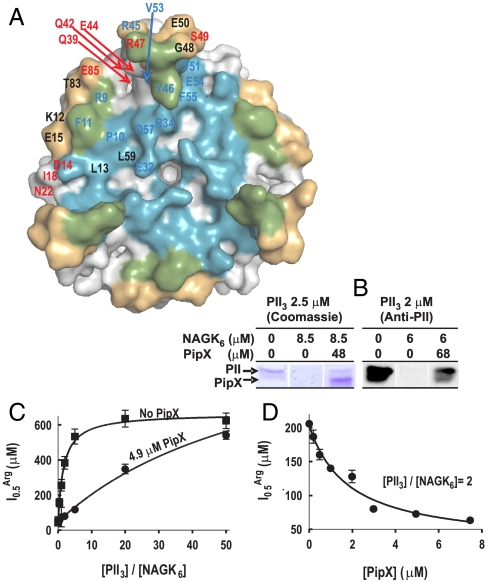
Fig. 3.
Competition between PipX and NAGK for PII. (A) Surface representation of PII, viewed along the threefold axis from the flat face side of the trimer. The blue, gold, and green areas correspond, respectively, to those regions involved in the interactions with PipX alone, with NAGK alone, or with both PipX and NAGK in the respective complexes. Residue numbers are indicated for one PII subunit in blue or red when their mutation to alanine (except for P10 and V53, which were mutated to L and G, respectively) respectively hampered or did not hamper the interaction with PipX in Y2H assays. The residues in black were not mutated. (B) Ultrafiltration assays of PII binding to NAGK (7) reveal that PipX (added together with NAGK to a PII solution) prevents incorporation of PII into the bulky complex with NAGK, leading to the appearance of PII in the ultrafiltrate [shown by SDS/PAGE and either Coomassie-staining (left), or by western blotting and immunostaining with an anti-PII antibody (33), right]. PII and NAGK concentrations are given in terms of trimers and hexamers, respectively. (C and D) Influence of PipX on the concentration of arginine causing 50% inhibition ( ) in hydroxylamine-based NAGK activity assays (11) also containing PII. The
  values (with standard error bars) were estimated from plots of activity versus arginine concentration. In C the amount of PII3 (denoting trimers) was varied, whereas in D PipX was varied at a constant PII3/NAGK6 ratio. In both figures NAGK6 (denoting hexamers) concentration was 24 nM.

