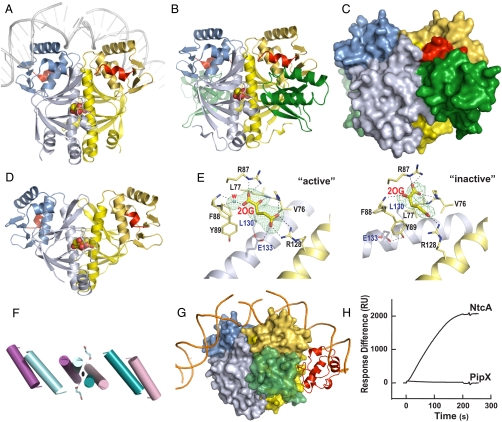
Fig. 4.
NtcA structure and activation by 2OG and PipX. Unless otherwise indicated, one NtcA subunit is colored bluish and the other yellow, with the DNA-binding domain shown in darker hues. The C-terminal helix is depicted in red in both NtcA subunits, except in G. (A and D) Structure of the active (A) and inactive (D) NtcA dimer (in ribbon representation) with bound 2OG (in spheres representation). In A the superimposition with CRP–DNA (26) enabled the modeling of bound DNA (in gray). (B and C) The PipX–NtcA complex, with PipX in green in ribbon (B) or in surface (C) representation. (E) Detail of 2OG binding in the active (Active) and apparently inactive (Inactive) NtcA conformations. Electron density maps (Fo-Fc omit maps at 2.5σ) are shown for 2OG (and, in Active, for one water molecule). Broken lines denote hydrogen bonds. (F) Movements of the interfacial helix and the DNA-binding helices upon activation (active, blue; inactive, magenta). 2OG bound to the active form is shown in sticks representation. (G) Model of the PipX–NtcA complex (surface representation) with DNA and the α-CTD of RNAP (in ribbon, red). (H) SPR assay demonstrating the binding of NtcA (6 μg/ml) and lack in binding of PipX (5 μg/ml) to the glnA promoter in the presence of 1 mM 2OG. RU denotes response units of the Biacore instrument.

