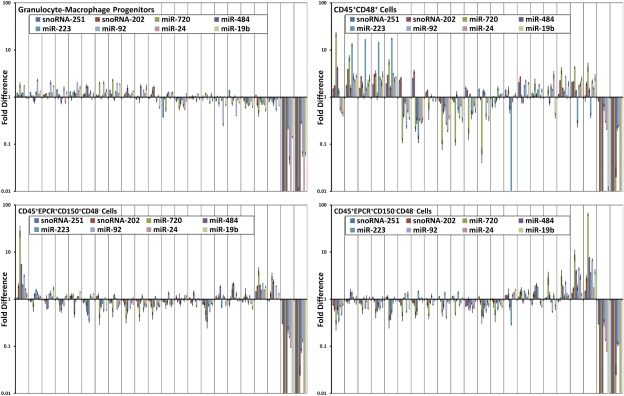
Fig. 5.
Variation of miRNA expression in single cells. Expression levels of 6 miRNAs and 2 sno-RNAs in 20 single cells are plotted for four sorted populations including GMPs—a population of functionally homogeneous cells; CD45+CD48+—cells that include many cell types; CD45+EPCR+CD150+CD48− cells (ES150+)—a population of stem cells of which a high proportion show durable self-renewal abilities; and CD45+EPCR+CD150−CD48− (ES150−) cells—a population of stem cells of which a high proportion show finite self-renewal abilities. All data are plotted as a log-fold ratio to the average of the population. Two NTC samples are shown on the right side of each graph.

