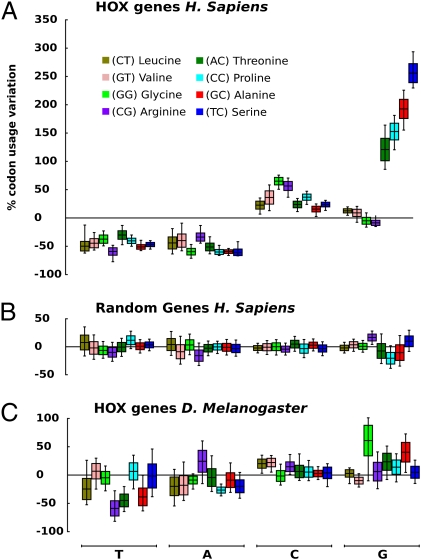
Fig. 3.
Variation in usage of 4d codons in Hox genes compared with the average genome values (Materials and Methods). (A) H. sapiens. (B) Randomly chosen H. sapiens protein-coding genes. A total of 39 genes have been retrieved from the H. sapiens genome, the same number as in the Hox clusters. (C) Hox genes of D. melanogaster. Different colors mark these eight 4d-encoded amino acids with the first two nucleotides shown in parentheses. The horizontal line in the boxes represents the codon bias calculated from the original dataset (Materials and Methods). Upper and lower ends of boxes represent the SE of the bootstrap distribution. Whiskers represent the 0.95 adjusted bootstrap percentile (BCa) interval (bootstrap value = 100,000).

