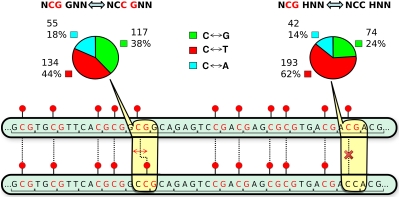
Fig. 4.
Conservation of the CpG profile in the coding region of Hox genes. Shown is an illustration of the effect of C↔G transversion in NCC-GNN and NCG-GNN pairs in comparison with NCC-HNN and NCG-HNN (H equals not G) pairs of neighboring codons. The pie charts show the observed frequencies (in percent) of C↔G (green), C↔T (red), or C↔A (cyan) substitutions between H. sapiens and M. musculus. See text for details.

