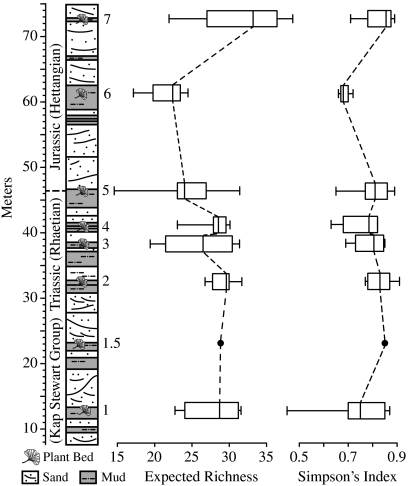
Fig. 1.
Schematic sedimentary log of the Astartekløft section (adapted from ref. 31). Box and whisker plot of rarefied within-sample sporomorph richness at 301 counted sporomorphs, and Simpson’s diversity index. Boxes show median and interquartile range. Whiskers represent maximum and minimum.

