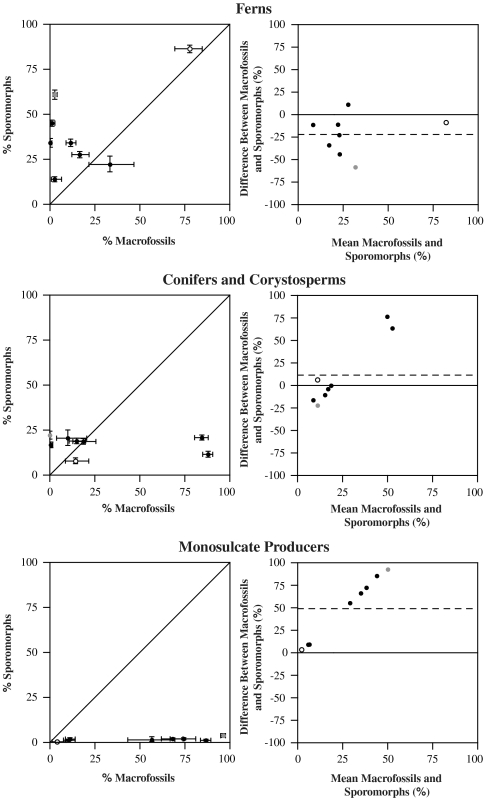
Fig. 4.
Scatter diagrams and mean-difference plots illustrating the agreement between the macrofossil and sporomorph records of the Astartekløft vegetation. Each plant bed represented by a single data point (n = 8). Closed black circles = plant beds 1–5 (overbank deposits), open circle = plant bed 6 (poorly developed coal swamp) and closed grey circle = plant bed 7 (abandoned channel). Scatter diagrams: solid diagonal line of equality, error bars represent 95% binomial confidence intervals. Mean-difference plots: solid horizontal line of equality, dashed horizontal line showing mean difference between macrofossil and sporomorph records.

