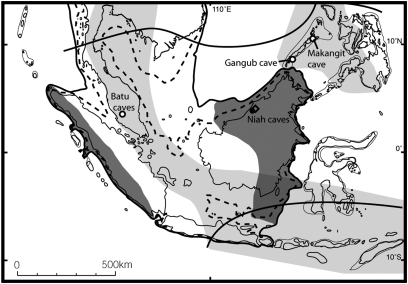
Fig. 1.
Map of Southeast Asia showing the land–sea distribution during the Last Glacial Maximum estimated from the 120-m bathymetric line. A dashed line indicates the 50-m bathymetric line, which is a better representation of land–sea distribution at the time of human migration into the region. Study sites are displayed, where solid black (white) indicates evidence for forest (open) conditions during the LGM. The diamond represents the site location of a speleothem record (34). Earlier proposed savanna (9) and rainforest refugia (10) are indicated by light gray and dark gray shading. Solid lines indicate contemporary tropical lowland forest distribution.

