Fig. 1.
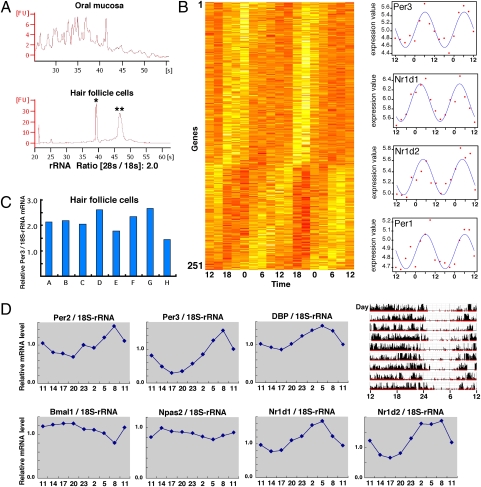
Biological rhythms exist in hair follicle cells of the scalp and are useful for measuring human clock gene expression rhythms. (A) Qualitative comparison of total RNA obtained from the oral mucosa or hair follicle cells of the scalp. Total RNA was collected from both samples and isolated by electrophoresis. Single and double asterisks indicate 18S and 28S rRNA, respectively. (B) DNA microarray analysis was performed to comprehensively measure rhythms of gene expression in hair follicle cells. Based on the 48-h diurnal expression profiles, genes with circadian expression were organized in a phase sequence (see SI Materials and Methods for details). Dataset S1 presents gene names in detail. The darker the color, the higher the gene expression, in each time zone. This gene group includes Per1, Per3, Nr1d1, and Nr1d2. The right figures show the actual values for these four clock genes (scatter diagram) and the fitted cosine curves. (C) Using total RNA collected from 10 scalp hairs, real-time PCR was performed to measure the expression of Per3. This was repeated eight times to assess fluctuation. Expressions relative to 18S rRNA are shown. (D) Scalp hair samples were collected every 3 h to ascertain rhythms of clock gene expression by real-time PCR. Expressions relative to 18S rRNA are shown. (Upper Right) Activity data over a period of about 9 d for the same individual. The final day in the actogram is the sampling day. The P values in cosine curve fitting are Per2 (0.0062), Per3 (0.0010), Dbp (0.00029), Bmal1 (0.016), Npas2 (0.030), Nr1d1 (0.00019), and Nr1d2 (0.00039).

