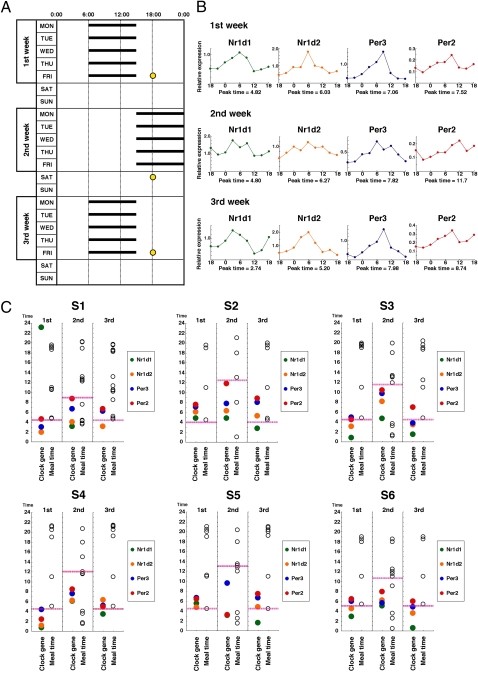
Fig. 3.
Rhythms of clock gene expression in rotating shift workers. (A) The work shift table is shown for six rotating shift workers (S1–S6). At time points indicated with a yellow circle, scalp hair samples were collected every 3 h to ascertain rhythms of clock gene expression. (B) Clock gene expression rhythms in an individual are shown as representative of the six workers. Expression data relative to 18S rRNA are shown. Cosine curve fitting was applied to clock gene expression data, and the peak times were calculated. (C) In S1–S6, the average waking time (pink dashed line), meal times (open circles), and peak time of clock gene expression (colored circles) are plotted against time.

