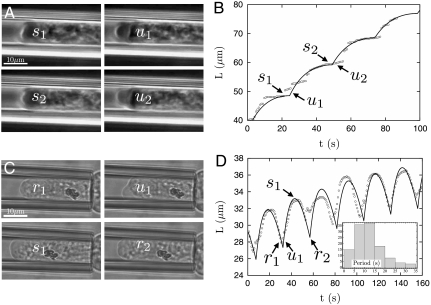
Fig. 5.
Representative motions of the E. histolytica inside the pipette in the Saltatory (A and B) and Oscillatory (C and D) pipette suction regimes. (see Movies S1 and S2). (A) and (C) Snapshots of the tip of the cell inside the pipette at different instants in time. (B) and (D) Corresponding tracking of the tip position with time, and theoretical fit (black lines). (D Inset) Histogram of the oscillation periods (from 147 oscillations observed on five different cells). The average period is 10–15 s. The fits are based on the force balance, Eq. 1, with a time-varying cortex thickness controlled by polymerization (vp = 60 nm/s) and depolymerization (1/kd = 25 s) and neglecting the rear cortical tension of the cell (see text). The cortex flow is assumed to be controlled by the friction with the pipette walls (L > Lf). The effects of membrane tension cancel out in the saltatory regime as the cell is entirely engulfed inside the micropipette. All parameters are discussed in SI Text and are the same as in Fig. 2, with a critical rupture force  , giving an unbinding thickness hb = 0.95 μm. The transition between the two regimes is solely driven by the pipette pressure ΔP (= 1.2 kPa—oscillatory and = 1.9 kPa—saltatory regime), corresponding to retraction thicknesses hs = 0.6 μm (oscillatory) and 0.95 μm (saltatory).

