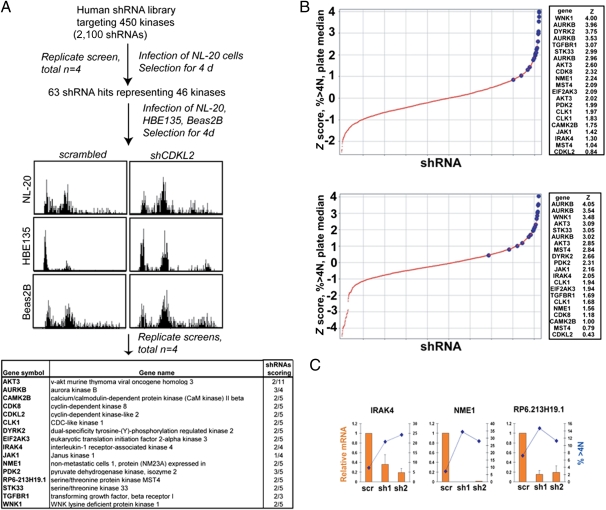
Fig. 2.
shRNA screen identifies kinases that regulate chromosomal stability. (A) Flow chart describing the screening of a kinase shRNA library for kinases whose knockdown causes an increase in ploidy. NL-20 cells were infected in quadruplicate in 96-well plates, and ploidy was assessed by flow cytometry 4 d postinfection. Primary hits were rescreened against three different cell lines to find the strongest hits shown in the table. (Right) Column indicates the number of unique shRNAs that showed a ploidy phenotype. (B) Z score distribution (>4N) for two of the replicate screens. Z scores relative to the plate median of the percentage of cells with greater than 4N DNA content were calculated for each data point in each of four replicate screens. The large blue markers represent shRNAs that scored in follow-up screens in additional cell lines. (Right) Z scores for these shRNAs are shown. (C) Correlation of increased ploidy with gene knockdown. HBE135 cells were transduced with the indicated shRNAs. After 4 d, mRNA was prepared and cells were fixed for flow cytometric measurement of DNA content. The level of mRNA was calculated by measuring the ratio of the indicated gene to GAPDH for the indicated shRNAs vs. the same ratio in control samples. For flow cytometry, the percentage of cells with greater than 4N DNA content is shown. scr, scrambled; sh, short hairpin.

