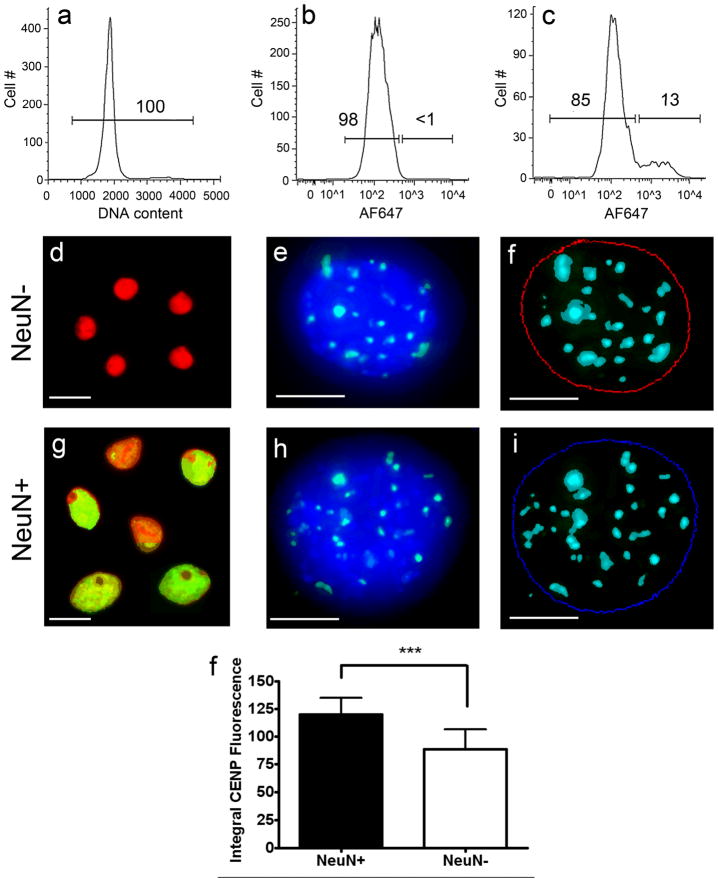
Figure 14. Peptide nucleic acid (PNA) FISH analysis of FACS sorted nuclei.
Human cortical nuclei were stained with the DNA dye, propidium iodide (PI), and immunolabeled with the neuronal marker NeuN prior to PNA FISH. NeuN was detected using an Alexa Fluor 647 (AF647) labeled secondary antibody. Using FACS, all PI stained nuclei (a) were sorted into NeuN positive and NeuN negative populations (c) based on the NeuN secondary antibody-alone control (b). Numbers shown on the plots refer to the percent of the nuclei that fall within the gated populations. Purified neuronal (g–i) and non-neuronal (d–f) nuclear populations were subjected to FISH using CENP-B box sequence specific peptide nucleic acid (PNA) probes (green signals in e and h). Z-stack images of each nucleus were acquired using deconvolution microscopy (McNally et al., 1999) and the resulting images were projected to form a pseudo-three dimensional image (e and h). Thresholds for DAPI fluorescence and PNA probe fluorescence were set using MetaMorph analysis software to quantitate integral PNA fluorescence within the DAPI borders of each nucleus (blue and red circles in f and i). A minimum of 30 nuclei were analyzed for NeuN positive and NeuN negative fractions for each of 4 samples. NeuN positive nuclei had a ~36% increase in CENP-B fluorescence relative to NeuN negative nuclei (j, P < 0.0001). These results provide further evidence that the additional DNA seen in neuronal nuclei relative to non-neuronal nuclei by DNA content FCM/FACS, Southern blotting, and QPCR is genomic in origin. Scale bars = 10 μm in d, g and in 5 μm in e, f, h, i. A magenta green version of this figure has been posted as a supplementary file.

