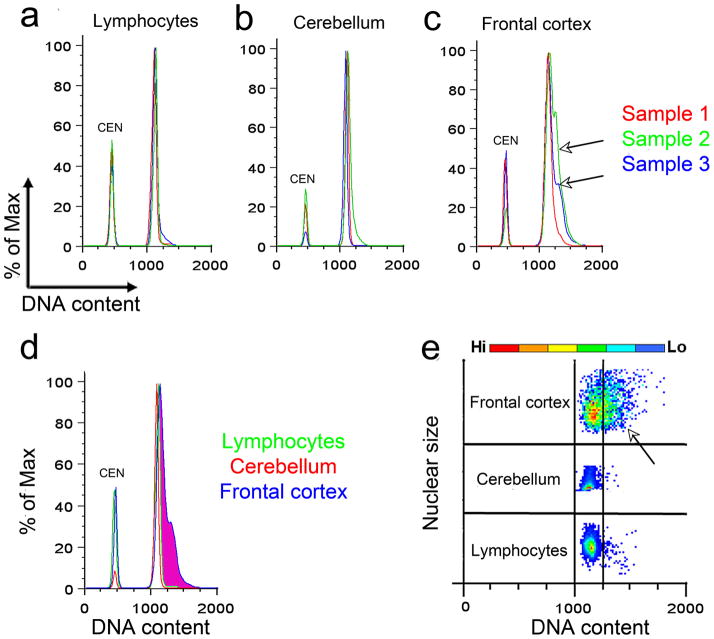
Figure 2. DNA content analysis of non-diseased human nuclei by flow cytometry.
a-c: Representative DNA content histograms from three samples of human lymphocyte (a), cerebellar (b), and human frontal cortical (c) nuclei (red, blue, and green are separate individuals for lymphocytes, cortex, and cerebellum) stained with propidium iodide (PI) and analyzed by FCM. Chicken erythrocyte nuclei (CEN) were included as an internal reference standard and control. Human lymphocytes and cerebellar samples demonstrated homogeneous and qualitatively indistinguishable histograms, while cortical samples displayed heterogeneous histograms with broad right-hand shoulders (lower black arrow, blue cortical histogram in c) and right-hand sub peaks (upper black arrow, green cortical histogram in c). d: Overlay of one representative lymphocyte (green), cerebellar (red), and cortical (blue) histogram identifies an area of increased DNA content uniquely within the cortical sample (magenta). While lymphocytes and cerebellar nuclei histograms were indistinguishable, cortical nuclei always contained populations with increased DNA content and more complex DNA histogram shapes. e: Orthogonal view of the DNA content histograms in which DNA content is plotted against nuclear size identifies the prevalence of nuclei having a given DNA content (prevalence is plotted using a color code where red signifies a large number of nuclei (Hi) and blue signifies a lesser number of nuclei (Lo)) along with scatter. Each scatter plot is only valid for the assessed sample. Vertical black bars serve as local reference lines encompassing expected DNA content for normal cells, beyond which nuclei with increased DNA content can be seen most prominently in the cortical sample (black arrow).

