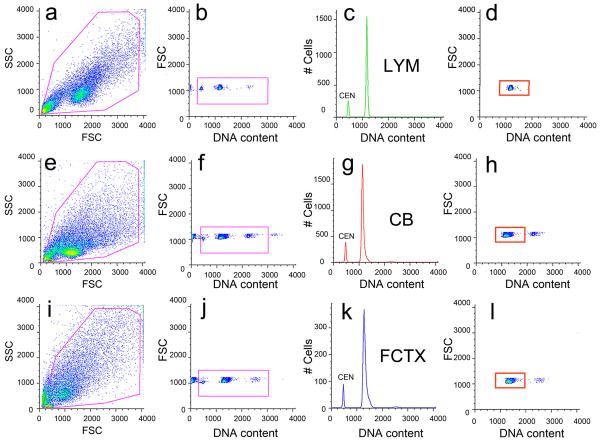
Figure 3. Electronic gating protocol and DNA index calculation for human nuclear samples stained with propidium iodide and analyzed by flow cytometry.
Human lymphocyte (a–d, LYM), cerebellar (e–h, CB), and frontal cortical (i–l, FCTX) nuclei were isolated, stained with propidium iodide and treated with RNaseA for a minimum of 90 minutes prior to analysis by FCM. Chicken erythrocyte nuclei (CEN) were included as internal controls to eliminate calibration errors. All nuclei (a,e,i) were gated (magenta boxes throughout figure) on forward scatter (FSC), a measure of nuclear size, and side scatter (Brasseur et al.), a measure of nuclear granularity, to remove nuclei doublets. DNA content was assessed using propidium iodide stained nuclei (b,f,j) to generate DNA content histograms (c,g,k) and orthogonal, top-down histogram views (d,h,l), which plotted nuclear size against DNA content in a pseudo-colored dot plot (blue shades represent few events and red shades indicate the majority of events). Representative gating protocols analyzing lymphocytes (a–d) were repeated for cerebellar (e–h) and cortical (i–l) samples. Mean DNA content values for a ‘diploid’ histogram were obtained from the gate delineated by the orange rectangle in d, h, and l in which only the lymphocyte DNA content is shown. In order to determine DNA index values for each sample, this mean DNA content value was compared to an average of the sex-matched lymphocyte samples to obtain a ratio. For example, if the mean value of male brain sample #1 was 1213 and the mean value for male lymphocytes was 1166, the DNA index for brain sample #1 would be 1213/1166 = 1.04.

