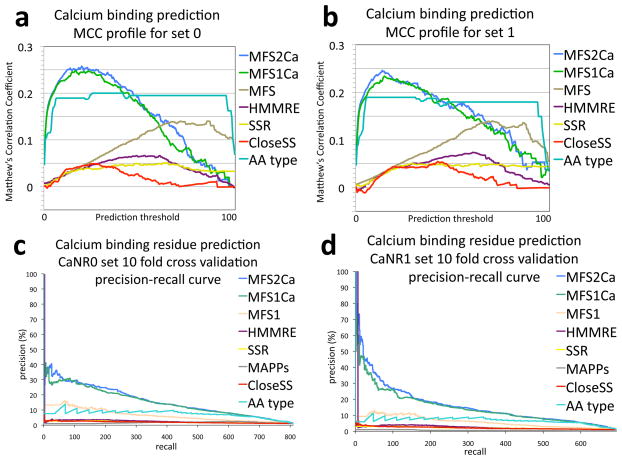
Figure 3.
Further analysis of calcium binding residue prediction accuracy in ten fold cross validation. Experiments were performed as described in the Figure 2 caption and the Research design and methods section. a,b) Distributions of Matthew’s correlation coefficients (MCC) across a standardized range of threshold scores for prediction of binding versus nonbinding for set 0 (a) and set 1 (b). c,d) Precision recall curves: The plot depicts the precision of predictions across the amount of binders retrieved for set 0 (c) and set 1 (d). These two analyses show a less optimistic perspective of success than the ROC analysis. Both depictions require far more accuracy than achieved here to reach values that appear to be near perfect prediction, for example compared to the 83% AUCoR of MFS2Ca shown in Figure 2 only consistently reaches 0.25 MCC and 40% precision. The precision recall curve clearly conveys the impact of the many false positive predictions when looking for a few instances within many, a needle in a haystack problem. In these instances the precision recall curve highlights the utility of training for a specific function, by a large separation between the MFSCa algorithms and the generalized MFS. Improvement over amino acid type is also highlighted by these depictions. The MCC distribution displays the difficulty in handling the ~89 to 1 incidence of nonbinders in the benchmark sets. The MCC distribution also shows the specific threshold score which gives the most additive value for predictions, as the corresponding threshold to the highest MCC. Multiple local extrema rather than a simple Gaussian distribution conveys nonlinear effects with respect to prediction score thresholds. Nonlinear prediction effects are not captured by simple regression models, and therefore motivate further study with more complex machine learning techniques such as neural networks, decision trees, and support vector machines.

