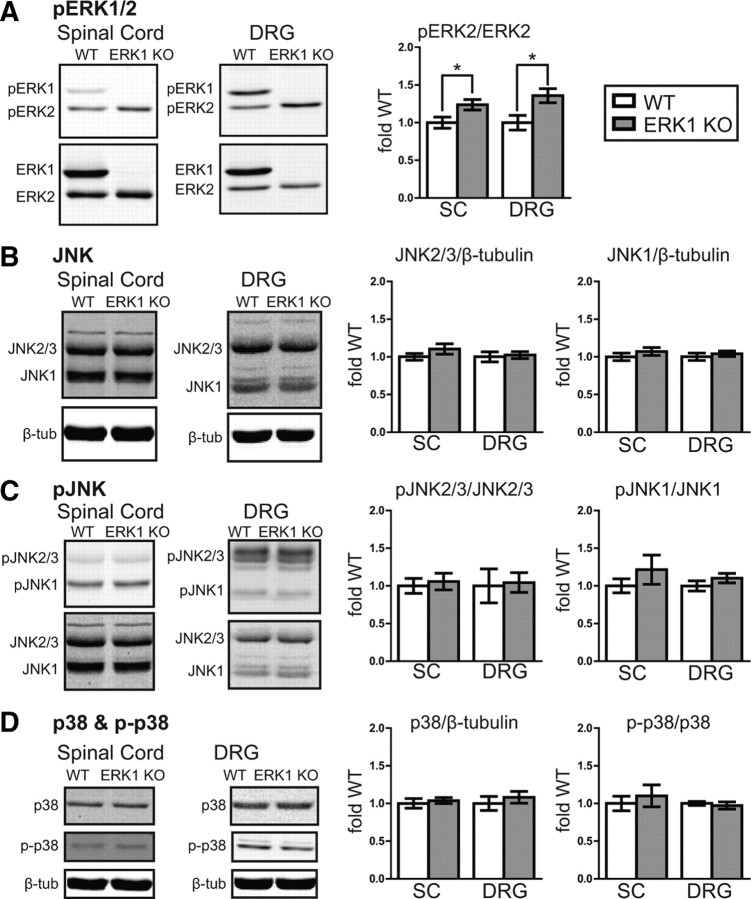
Figure 6.
In spinal cord and DRG, basal ERK2 phosphorylation increases in the absence of ERK1. A, Spinal cord (SC) homogenates from naive WT (n = 7) and ERK1 KO (n = 8) littermates were analyzed simultaneously for pERK1/2 and ERK1/2 by quantitative Western blot. Although there is no difference in total ERK2 expression in ERK1 KO spinal cord (Fig. 1), ERK2 phosphorylation is significantly elevated. Similar results were observed in whole-cell homogenates prepared from DRG (WT, n = 7; ERK1 KO, n = 8; unpaired t test, *p < 0.05). B–D, The same spinal cord and DRG homogenates were used to evaluate the expression and phosphorylation of related MAPKs, JNK and p38. The integrated intensities of JNK2/3, JNK1, and p38 bands were divided by corresponding loading control β-tubulin bands, normalized to the mean WT intensity, and expressed as fold WT. To evaluate phosphorylation, pJNK2/3, pJNK1, and p-p38 bands were divided by their corresponding total protein bands from the same samples, normalized, and then expressed as fold WT. No significant difference was detected between WT and ERK1 KO mice in either spinal cord or DRG (WT SC, n = 7; ERK1 KO SC, n = 8; WT DRG, n = 5; ERK1 KO DRG, n = 6; unpaired t test). WT data are represented with white bars, and ERK1 KO data are represented with gray bars. Error bars indicate SEM.

