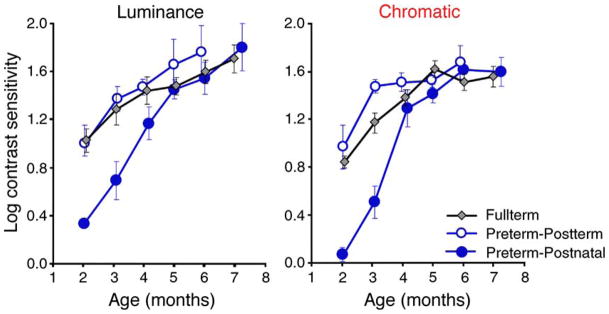
Figure 1.
Group mean log luminance (left) and chromatic (right) cone contrast sensitivity. The two preterm functions are the same infants, one plotted with respect to postterm age (open circles), and the other with respect to postnatal age (filled circles). For fullterm infants (diamonds), data are plotted with respect to postnatal age, but note that the mean postnatal and postterm ages are nearly identical for this subject group. Error bars denote standard errors of the mean.

