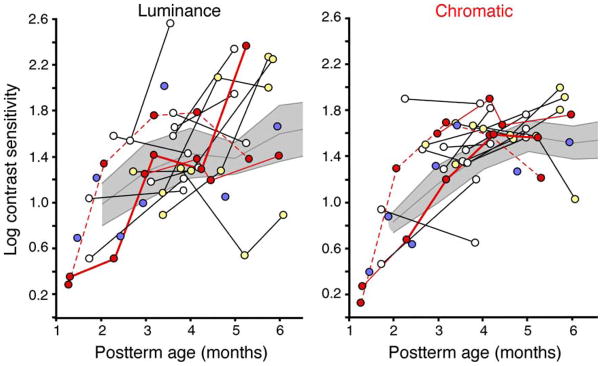
Figure 2.
Preterm infants’ individual log luminance (left) and chromatic (right) cone contrast sensitivity values plotted with respect to postterm age. Lines connect multiple time points. Blue, white, yellow, and red dots represent infants with 1, 2, 3, and 4/5 time points, respectively. The shaded area represents the 95% confidence intervals around the means from fullterm infants (central gray line).

