
Figure 2. Collagen accumulates in the adventitia.
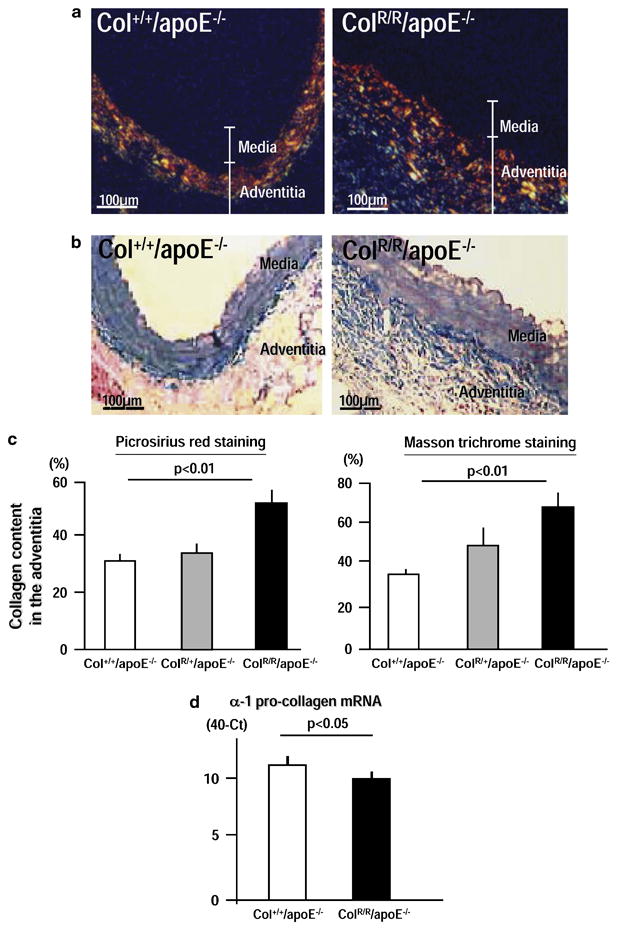
A, Representative cross-sections stained with picrosirius red viewed under polarization. B, Masson trichrome staining on cross-sections adjacent to those shown in A. C, Quantitative analysis of collagen content in the adventitia, determined by picrosirius red (left) and Masson trichrome (right) staining. Collagen increased in the adventitia of ColR/R/apoE−/− (n=8) compared to those of Col+/+/apoE−/− mice (n=8). D, Real-time RT-PCR demonstrated that α-1 collagen expression did not increase in the aortas of ColR/R/apoE−/− compared to those of ColR/R/apoE−/− mice. The data were obtained from three independent pooled total RNA samples of the aorta (n=2). Bars and error bars represent means and S.E.M, respectively.