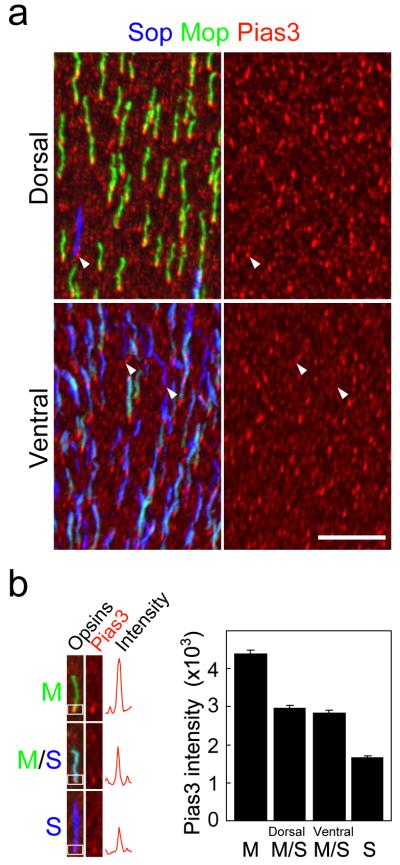
Figure 1.
Pias3 is preferentially expressed in cones expressing middle (M)-wavelength-sensitive cone opsins. (a) Horizontal view of dorsal (upper) and ventral (lower) region of a flat-mount retina from an 8wk C57BL/6 mouse immunostained with S-opsin (Sop, blue), M-opsin (Mop, green) and Pias3 (red) antibodies. Immunohistochemistry (IHC) was performed to visualize Pias3 (red channel), which is visualized separately on right panels. The arrowheads indicate cones expressing S-opsin alone that express lower levels of Pias3 than M-opsin expressing cones. Scale bar: 20 μm. (b) Quantification of Pias3 immunofluorescence by cone photoreceptor subtype. Left panel indicates the intensity from each cone subtype (M-only, M/S-coexpressing and S-only cones). Right panel represents Pias3 immunofluorescence of each cone subtype. The white boxes in the left panels represent the regions scanned in order to calculate Pias3 immunofluorescence intensity. All data are represented as mean ± s.e.m. (n = 100 for each cone subtype).

