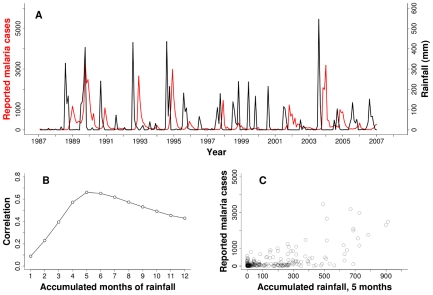
Figure 1. Malaria cases and rainfall.
(A) Monthly  malaria reported cases (red) and monthly rainfall from local stations (black) for Kutch. (B) Correlation between accumulated rainfall in different time windows preceding the month of reported cases. A maximum is observed when rainfall is accumulated over 5 to 6 months. (C) Monthly reported cases as a function of accumulated rainfall in the previous five months. A threshold, nonlinear response is apparent with no effect of rainfall below a value of around 200mm and an increase in both the mean and the variance of cases above it.

