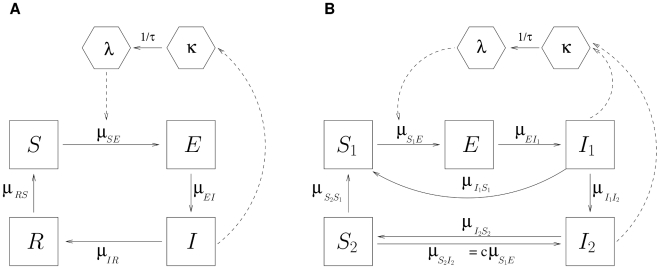
Figure 2. Flow diagram for two compartment models of malaria transmission.
(A) shows the VSEIRS model and (B) shows the  model. Human classes in (A) are
  (Susceptible),
  (Exposed),
  (Infected), and
  (Recovered). Mosquito classes are κ (latent force of infection) and λ (current force of infection). The possibility of transition between classes
  and
and  is denoted by a solid arrow, with the corresponding rate written as
  . The average time of mosquitoes in the latent state is denoted by
  . The dotted arrows represent interactions between the human and mosquito stages of the parasite. The model in (B) adds clinical immunity [25], by differentiating between clinical infections that contribute to the measured cases, and less severe infections in a new class
  that are not clinical but remain infectious to mosquitoes at a lower level than
  . Clinical infections can fully recover becoming susceptible again, or remain parasitemic and transition to
  . Recovery from mild infections results in individuals who are fully protected from clinical disease, in class
  , whose further exposure to infected mosquitoes, can result again in mild infections. In time, clinical immunity can also be lost, with transitions from
  to
to  , and therefore the return to full susceptibility. Only a fraction
  of individuals in
  contribute to the force of infection; the susceptibility to infection is reduced by a factor
  in class
  relative to
  .
.

