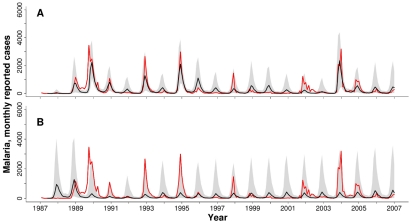
Figure 3. Reported monthly malaria cases and simulations for Kutch.
Black lines show the median of ten thousand simulations; the shadowed regions correspond to the range between the 10% and 90% percentiles of the simulations. Red lines show the reported cases. (A) VSEIRS model with rainfall; (B) VSEIRS model without rainfall. Note that these curves do not represent the fit of the model one time-step ahead but the numerical simulation from estimated initial conditions at the end of 1986 for the complete twenty years' period, using observed rainfall values.

