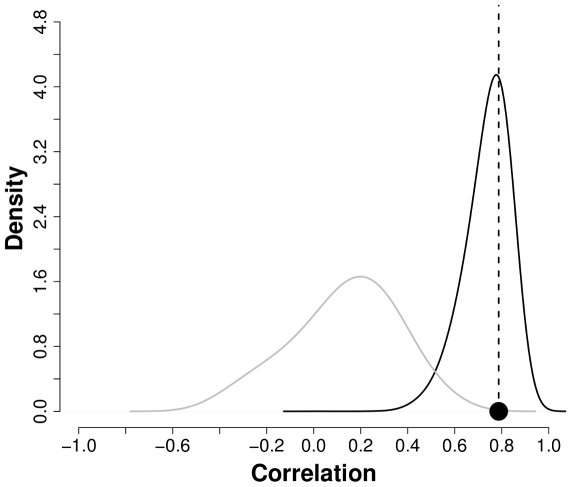
Figure 5. Density plot of correlation between the accumulated rainfall from May to August and the accumulated cases from September to December in 10,000 simulations from a set of 2,000 solutions for the  model with rainfall (black) and without rainfall (gray).
The vertical line is the observed correlation of 0.778. For the model with rainfall, 38.63% of the simulations have a correlation with rainfall above the observed value (black circle).

