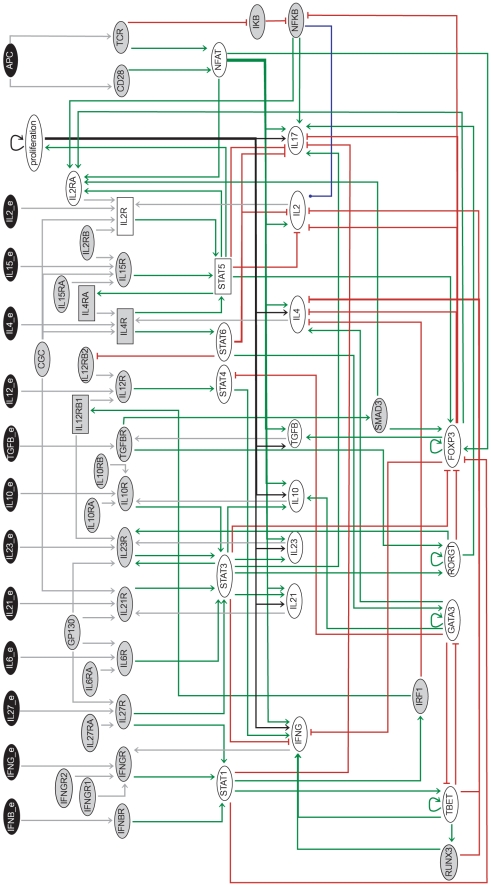
Figure 2. Th differentiation regulatory graph, encompassing 65 components.
The 13 input components are colored in black. Ellipses denote Boolean components while rectangles denote ternary components. Green arrows denote activations, whereas red blunt ones denote inhibitions. A peculiar blue arrow denotes the unique dual interaction. The greyed-out components have been reduced to generate the regulatory graph displayed in Figure 3.

