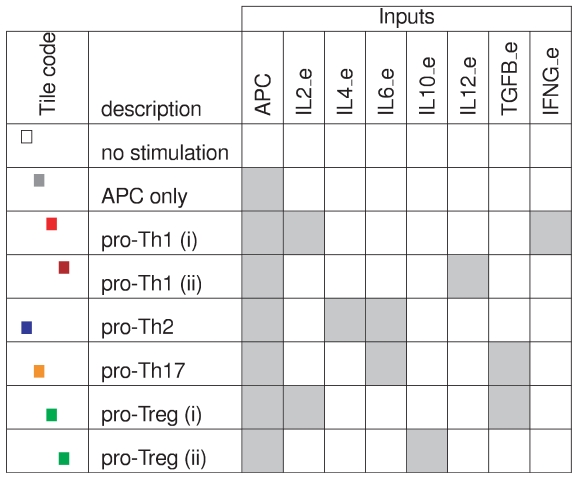
Figure 5. Environmental conditions used for the simulations.
Each row corresponds to one prototypic environment, defined in terms of combinations of APC and of seven different cytokine inputs. Presence/absence of the different inputs is denoted by grey/white cells. The coloured tile code defined in the first column is used in Figure 7 to denote environmental conditions.

