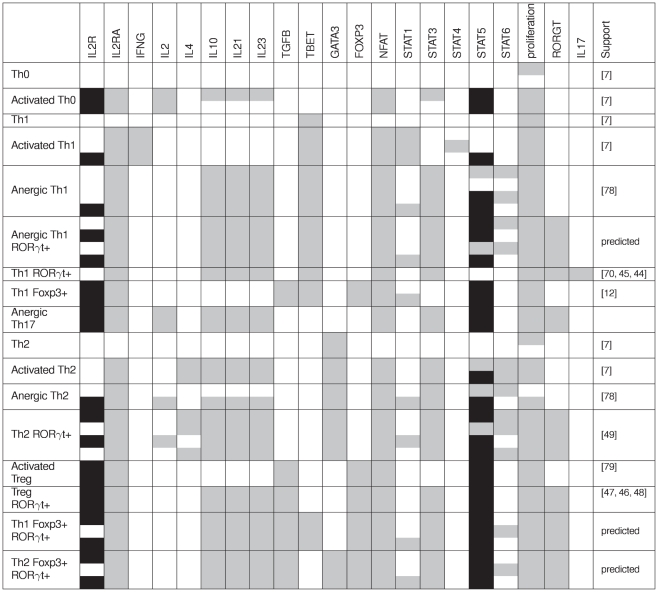
Figure 6. Context-dependent stable states and their component expression patterns.
A grey cell denotes the activation of the corresponding component (column entries) for the corresponding stable state (row entries). Black cells denote higher activity levels (in the case of multi-level components). Note that the values of the input nodes are omitted here. A state stable for a given input combination may become unstable for other input values. Relationships between these stable states and selected environmental conditions (described in Figure 5) are given in Figure 7. Activated cells (i.e. expressing NFAT and producing lineage-specific cytokines) and anergic cells (i.e. expressing NFAT but no lineage-specific cytokine) are indicated, when this classification clearly applies. Note that different stable states sharing a common pattern in terms of expression of master regulators but differing in the expression of other components are identified as the same Th cell subtype (as in the case of Th2 Foxp3+ ROR t+ subtype at the end of the table).

