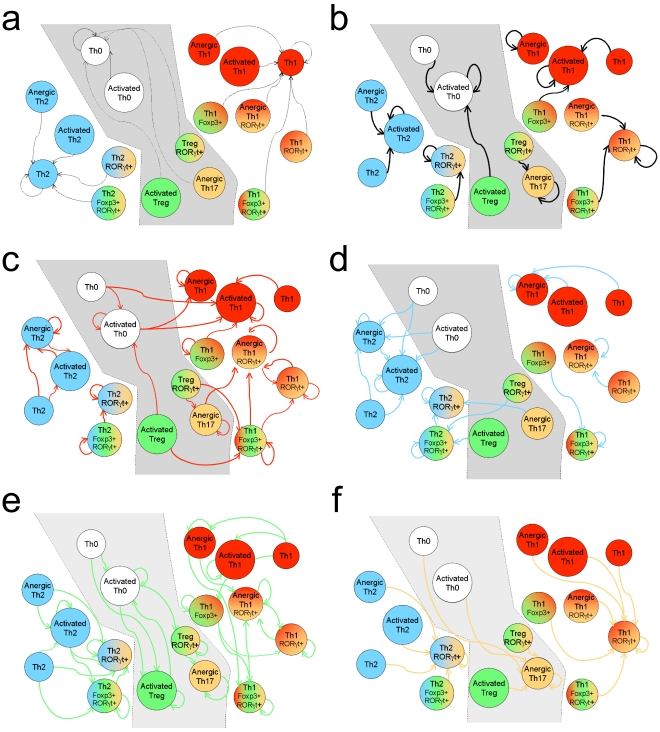
Figure 8. Graphical representation of the plasticity of cell subtypes depending on the environment.
The Th cell subtypes observed in silico are grouped into three main constellations (Th0, Th1 and Th2, delimited by different backgrounds). The different panels correspond to different environmental conditions listed in Figure 5: (a) no stimulation, (b) APC only, (c) pro-Th1, (d) pro-Th2, (e) pro-Treg, and (f) pro-Th17. Arrows between cell lineages denote switches elicited by the corresponding environment. Cell colouring denotes the activity of the master regulators: GATA3 (blue), T-bet (red), Foxp3 (green) and ROR t (orange).

