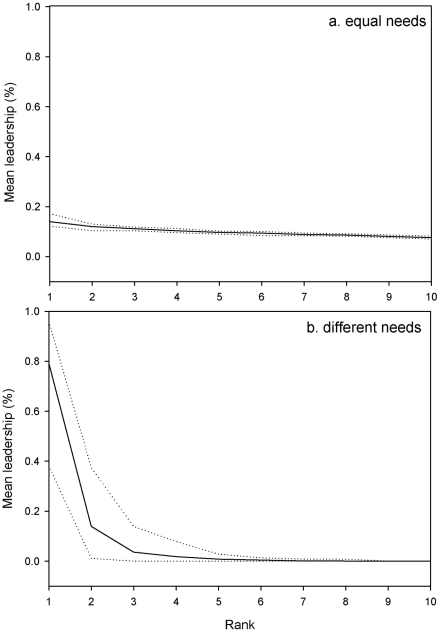
Figure 2. Mean leadership proportion or ratio (solid line) according to individuals with (a) equal needs and (b) different needs in groups of 10 individuals.
Individuals are ranked from the individual with the highest leadership proportion to the one with the lowest leadership proportion. The upper and lower dotted lines indicate respectively the maximum and minimum leadership proportions for each rank. The leadership proportion is different between individuals whatever the condition.

