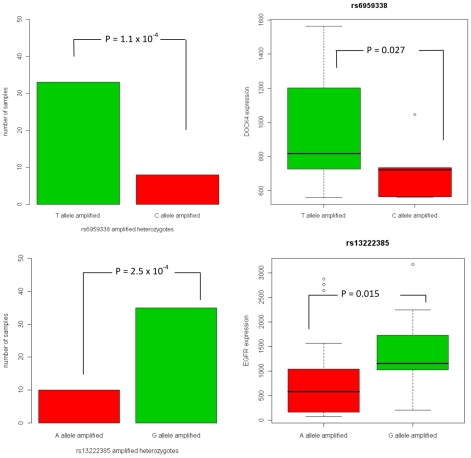
Figure 4. Selective allelic amplification and expression of SNPs in DOCK4 and EGFR.
The SNP rs6959338 in DOCK4 shows preferential amplification of the T allele (upper left), as well as higher expression levels in samples amplifying T instead of C (upper right). Similarly, rs13222385 shows preferential allelic amplification (lower left) and expression (lower right).

