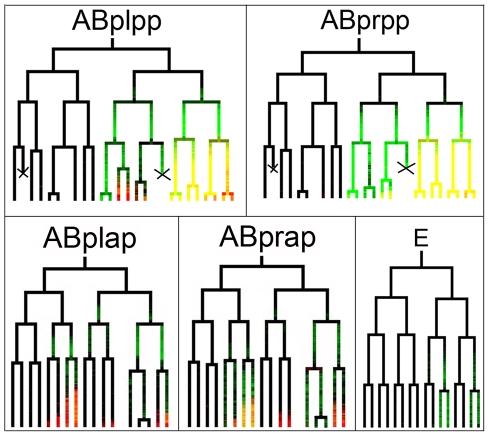
Figure 6. Embryonic lineage-based expression of nob-1.
Shown are the superimposed lineage based expression trees between NOB-1::GFP (green) and mir-57::HIS-24:mCherry (red). The branch lengths (division timing) of nob-1 and mir-57 expressing trees are normalized against Sulston's lineage trees and the expression values are interpolated accordingly. In lineages expressing both genes, such as the ABpl/rpppp lineages, nob-1 signal appears a full cell cycle before the onset of mir-57 expression. Cell deaths are indicated with “X”.

