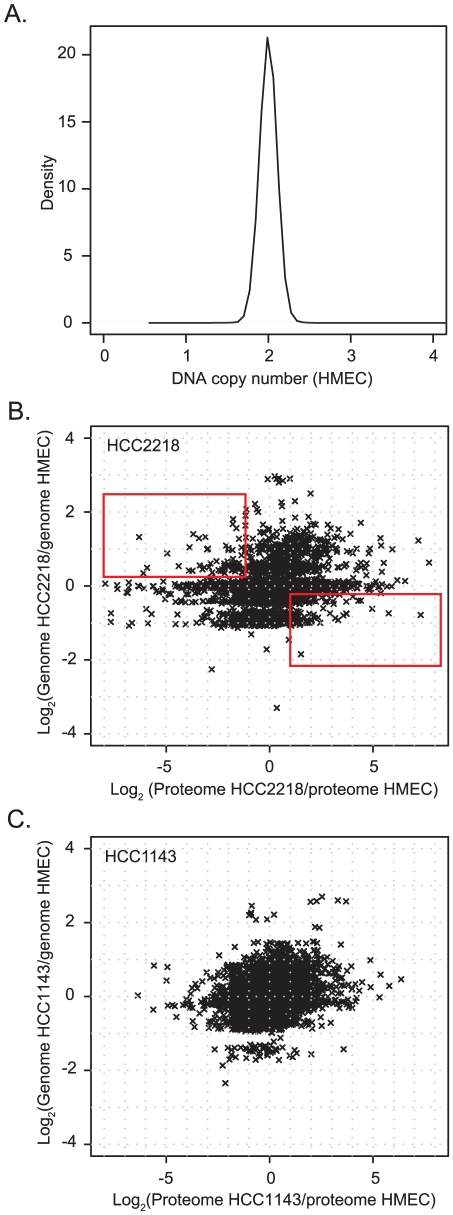
Figure 2. Comparison of gene copy number change to protein change.
(A) Density plot of Affymetrix smooth signal in the HMEC control cells. A small peak at zero was removed, which was caused by probes for the Y-chromosome, which was absent in this female cell line. (B,C). Scatter plot of gene copy number in HCC2218 cells (B) or HCC1143 cells (C) normalized to the copy number of genes in HMEC vs. the ratio of the proteins in HCC1143 or HCC2218 cells relative to HMEC. The rectangle in the upper left part of (B) encloses genes with increased gene copy compared to control cells but decreased protein expression. The rectangle in the lower right contains single copy genes with increased protein expression compared to control cells.

