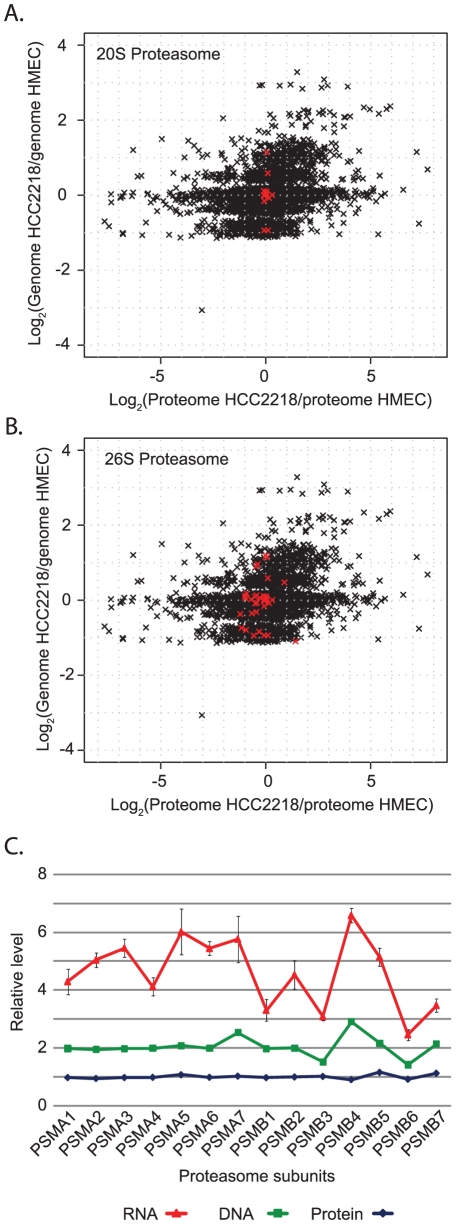
Figure 5. Distribution of proteasomal genes, proteins and mRNA.
(A) Scatter plot of global ratio distribution of genes vs. proteins in HCC2218. The core 20S proteasome components are highlighted in red. (B) Scatter plot with the 26S proteasome highlighted in red. (C) Stacked plot of protein, gene and mRNA level of 14 proteasomal subunits, normalized to the level in HMEC.

