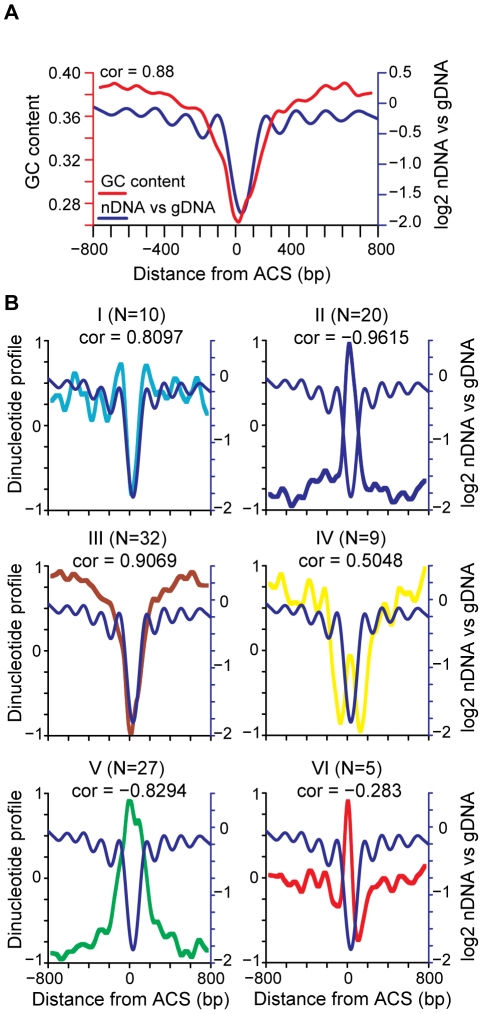
Figure 2. Correlation of nucleosome position with DNA sequence features.
(A) GC content (red line) and nucleosome occupancy are plotted (blue line), with the Pearson correlation indicated. (B) Average dinucleotide profile is plotted for each of the six groups of dinucleotide properties (I–VI). The average nucleosome occupancy is also plotted for comparison (blue line). The average DNA dinucleotide profiles were partitioned into 6 groups using k-means clustering. The subcluster average DNA dinucleotide profile, re-scaled to a range of +1 to −1, is shown for each. The number of dinucleotide properties in each group (N) is indicated along with the Pearson correlation of each group with the average ACS profile.

