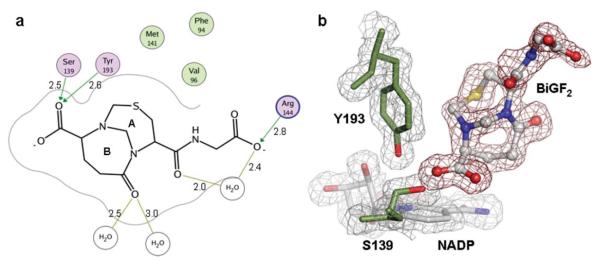
Fig. 1.
(a) Binding mode of CBR1·BiGF2. Hydrogen bonding interactions and residues within a distance of 4.0 Å from the ligand are shown. Non-polar residues (green), polar residues (purple), and charged residues (purple/blue) are indicated. Distances are given (Å). (b) Electron density maps of CBR1·BiGF2. The 2Fo – Fc map is contoured in gray at a level of 1 σ. The Fo – Fc map is contoured in red at a level of 2.75 σ. NADP (gray, blue and red) and BiGF2 (grey, red, blue and yellow) are shown occupying the CBR1 active site.

