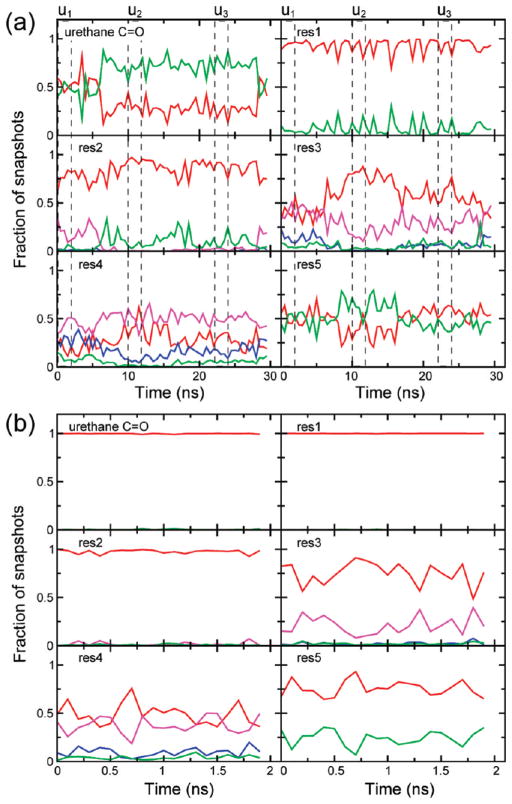
Figure 3.
Hydrogen bonding pattern for (a) trajectory u, averaged over blocks of 500 ps, and (b) trajectory r averaged over blocks of 100 ps. Red, 310-helix; blue, α-helix; magenta, both 310- and α-helices; green, nonhelical configuration. The u1 (0–2 ns), u2 (10–12 ns), and u3 (22–24 ns) segments are marked with broken lines.

