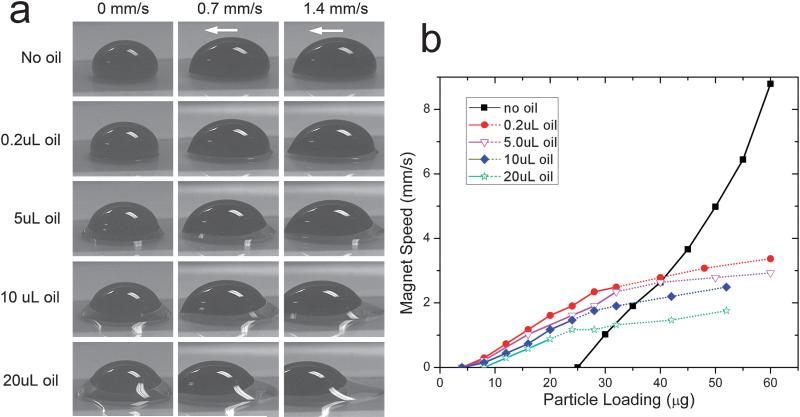
Fig. 5.
Effect of oil loading on dynamic droplet shape (a) and on the operating diagram (b). The white arrows refer to the transport direction. Solid and dotted plots represent operating boundaries OB1 and OB2, respectively. The volume of the aqueous phase was 50 μL in all cases. A stock suspension (~20 μg/μL) of 0.5 μm diameter SiMAG particles was used for the test.

